Kubernetes alerts
that just work.
Event-driven monitoring for developers and startups on their first cluster. One Pod, one ConfigMap, ~64Mi of memory. Slack, email, and webhooks out of the box.
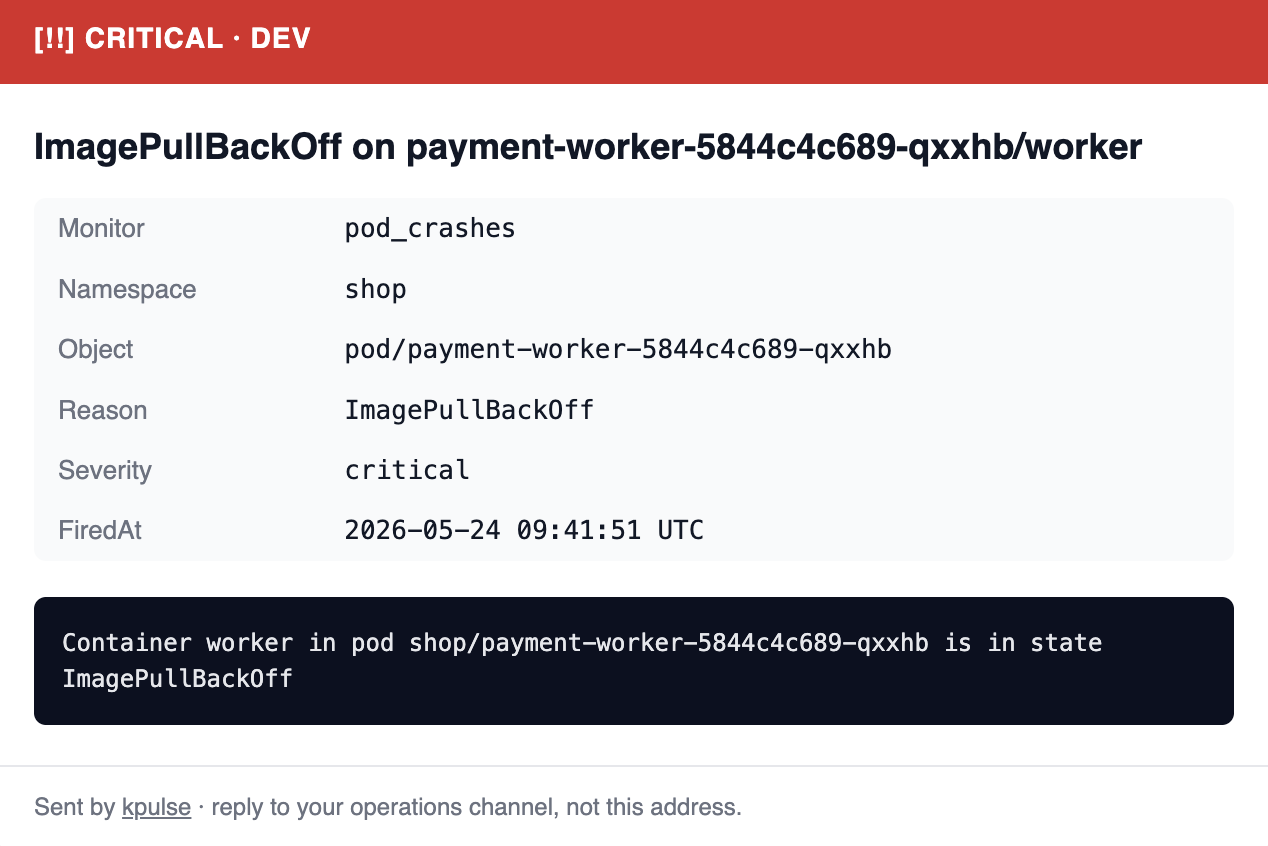
curl -fsSL https://kpulse.io/install.sh | bashAn alert you can act on, in seconds.
No dashboard to open, no query to write. kpulse delivers the namespace, object, reason, and the last log lines straight to your channel of choice.
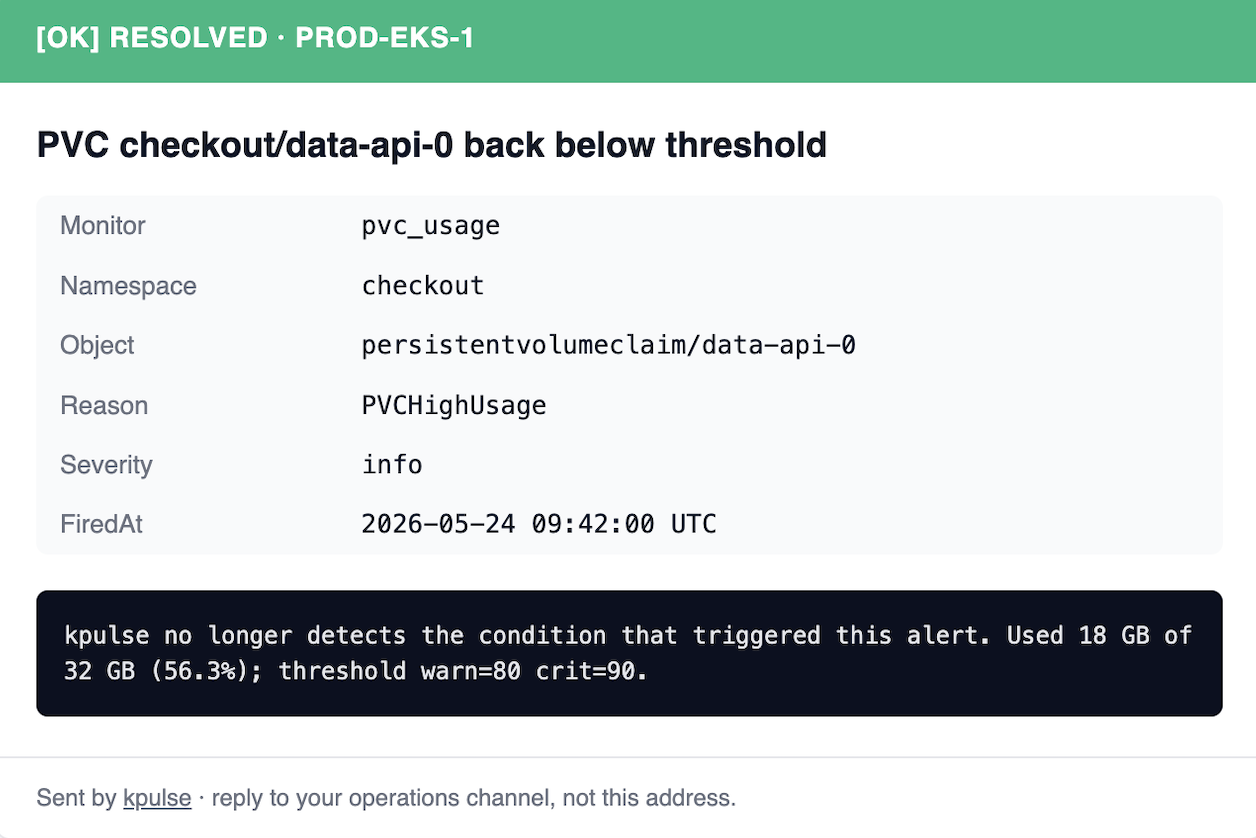
Auto-recovery alerts, so you can close the tab.
Every alert gets a matching [OK] RESOLVED message the moment kpulse sees the condition clear. No stale incidents, no manual acks, no "is this still firing?" pings at 2am.
- • Same channel, same thread context — fire and recover, side by side.
- • Includes the final value vs threshold so you know it really went back to normal.
- • Works for every monitor: PVC usage, pod crashes, job failures, cert expiry, and more.
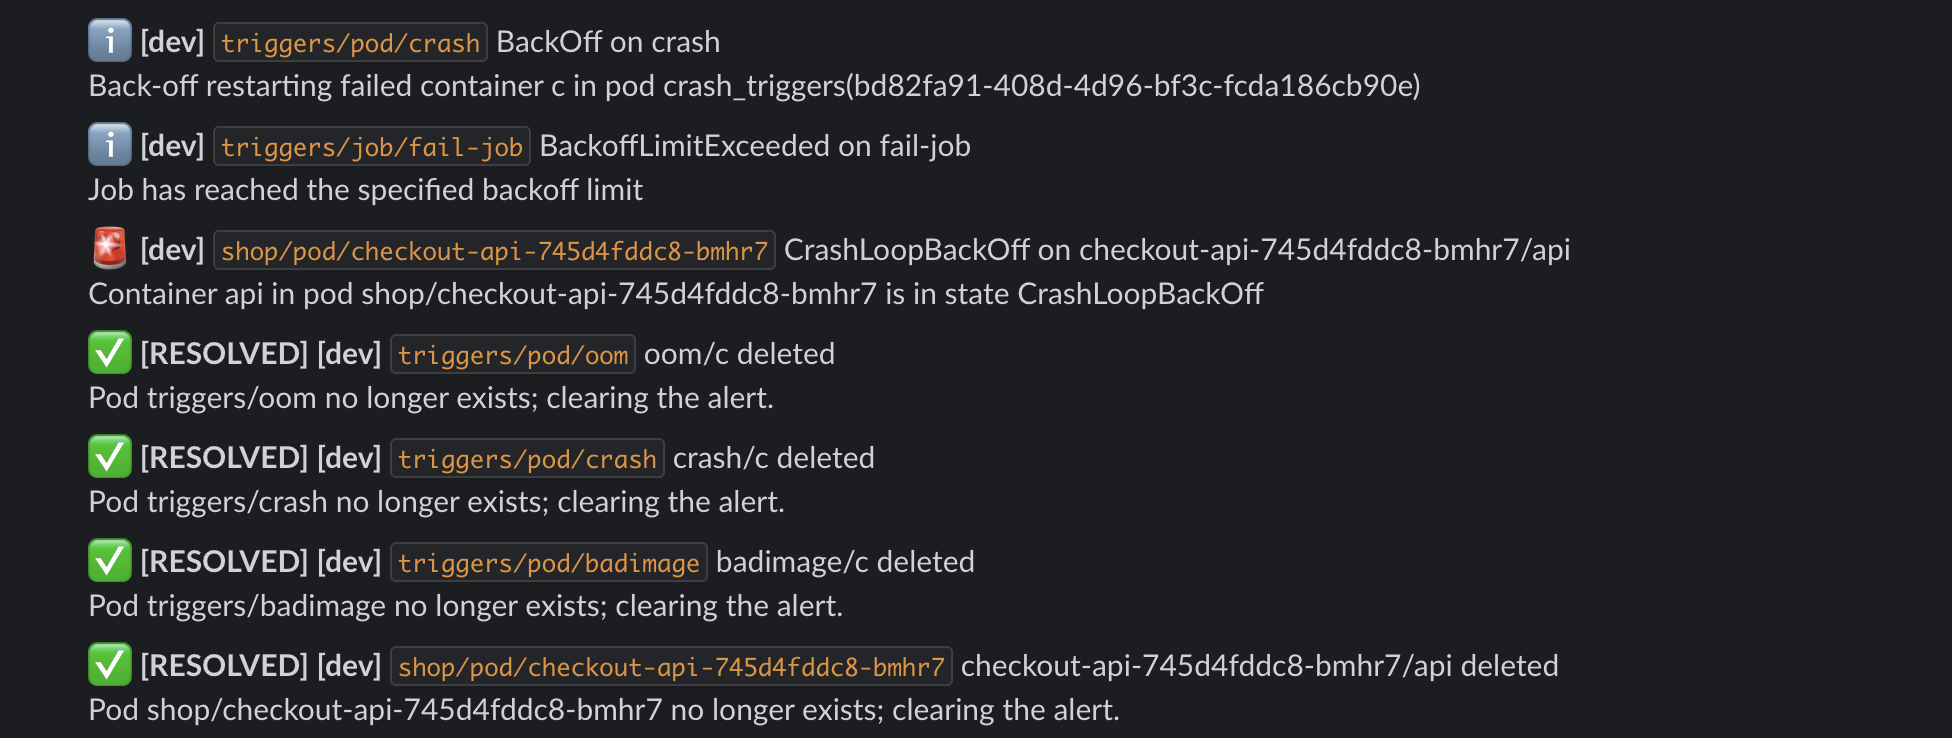
Right where your team already lives.
Compact, scannable Slack messages with severity, namespace, object, and reason — color-coded so a glance is enough. Resolved alerts land in the same channel, so your incident history reads itself.
- • One-line summaries that fit your channel without taking it over.
- • Dedupes noisy events so you don't get the same alert 40 times.
- • Works with any Slack webhook — no app install, no OAuth dance.
// why kpulse
Prometheus is great — until you just want to know when a pod crashes.
Day-1 ready
Install, paste one Slack webhook, you have alerts on the 12 most common failure modes. No tuning weekend required.
No time-series stack
No Prometheus, no Grafana, no Alertmanager, no PVCs. kpulse listens to the Kubernetes API and sends.
Sane defaults
All 12 monitors on. Thresholds tuned to be silent on a healthy cluster. Dedupe and digest built-in.
Your monitoring stack shouldn't be bigger than your app.
kpulse is the lightweight alternative when all you need is to know the moment something breaks.
// 12 monitors out of the box
The failures that wake teams up.
Each fires on a tuned threshold. Each can be silenced or rerouted via ConfigMap.
CrashLoopBackOff, OOMKilled, ImagePullBackOff
> 5 restarts in 15 min
Warning k8s Events, noise filtered
PVC > 80% warn, > 90% crit
DiskPressure, MemoryPressure, NotReady
rootfs/imagefs > 85% warn, > 92% crit
TLS Secret < 14d warn, < 3d crit
Deployment/StatefulSet rolling > 15 min
Job condition Failed=True
> 2 missed schedules
HPA pinned at maxReplicas > 30 min
desired != ready > 10 min
// install
Three commands. One alert pipeline.
- 1
Install
$ installcurl -fsSL https://kpulse.io/install.sh | bash - 2
Configure a channel
$ configurekubectl -n kpulse edit configmap kpulse-config # set cluster.name, enable a channel kubectl -n kpulse edit secret kpulse-secrets # add e.g. SLACK_WEBHOOK_URL kubectl -n kpulse rollout restart deploy/kpulse - 3
Test it
$ testkubectl -n kpulse port-forward svc/kpulse 8080:8080 & curl 'http://localhost:8080/test-channel?name=slack'
kubectl apply -f https://github.com/dnl555/kpulse/releases/latest/download/kpulse.yamlhelm install kpulse ./charts/kpulsegit clone … && make build image// channels
Ping the channel
of your choice.
Pick any subset. Every alert goes through the same dedupe and digest engine before it leaves the cluster.
// optional UI
Or open a
browser.
v0.3.0 ships a small read-only UI embedded in the binary. Off by default; flip ui.enabled: true and port-forward to see exactly what's firing, what cleared, and per-monitor counters since startup.
- ~25 KB embedded, zero CDN deps, works air-gapped
- Vanilla HTML/CSS/JS (no React/Tailwind/Alpine bundles)
- Read-only beyond Reset-dedupe + Send-test buttons
- Same JSON API at
/api/v1/*for scripts
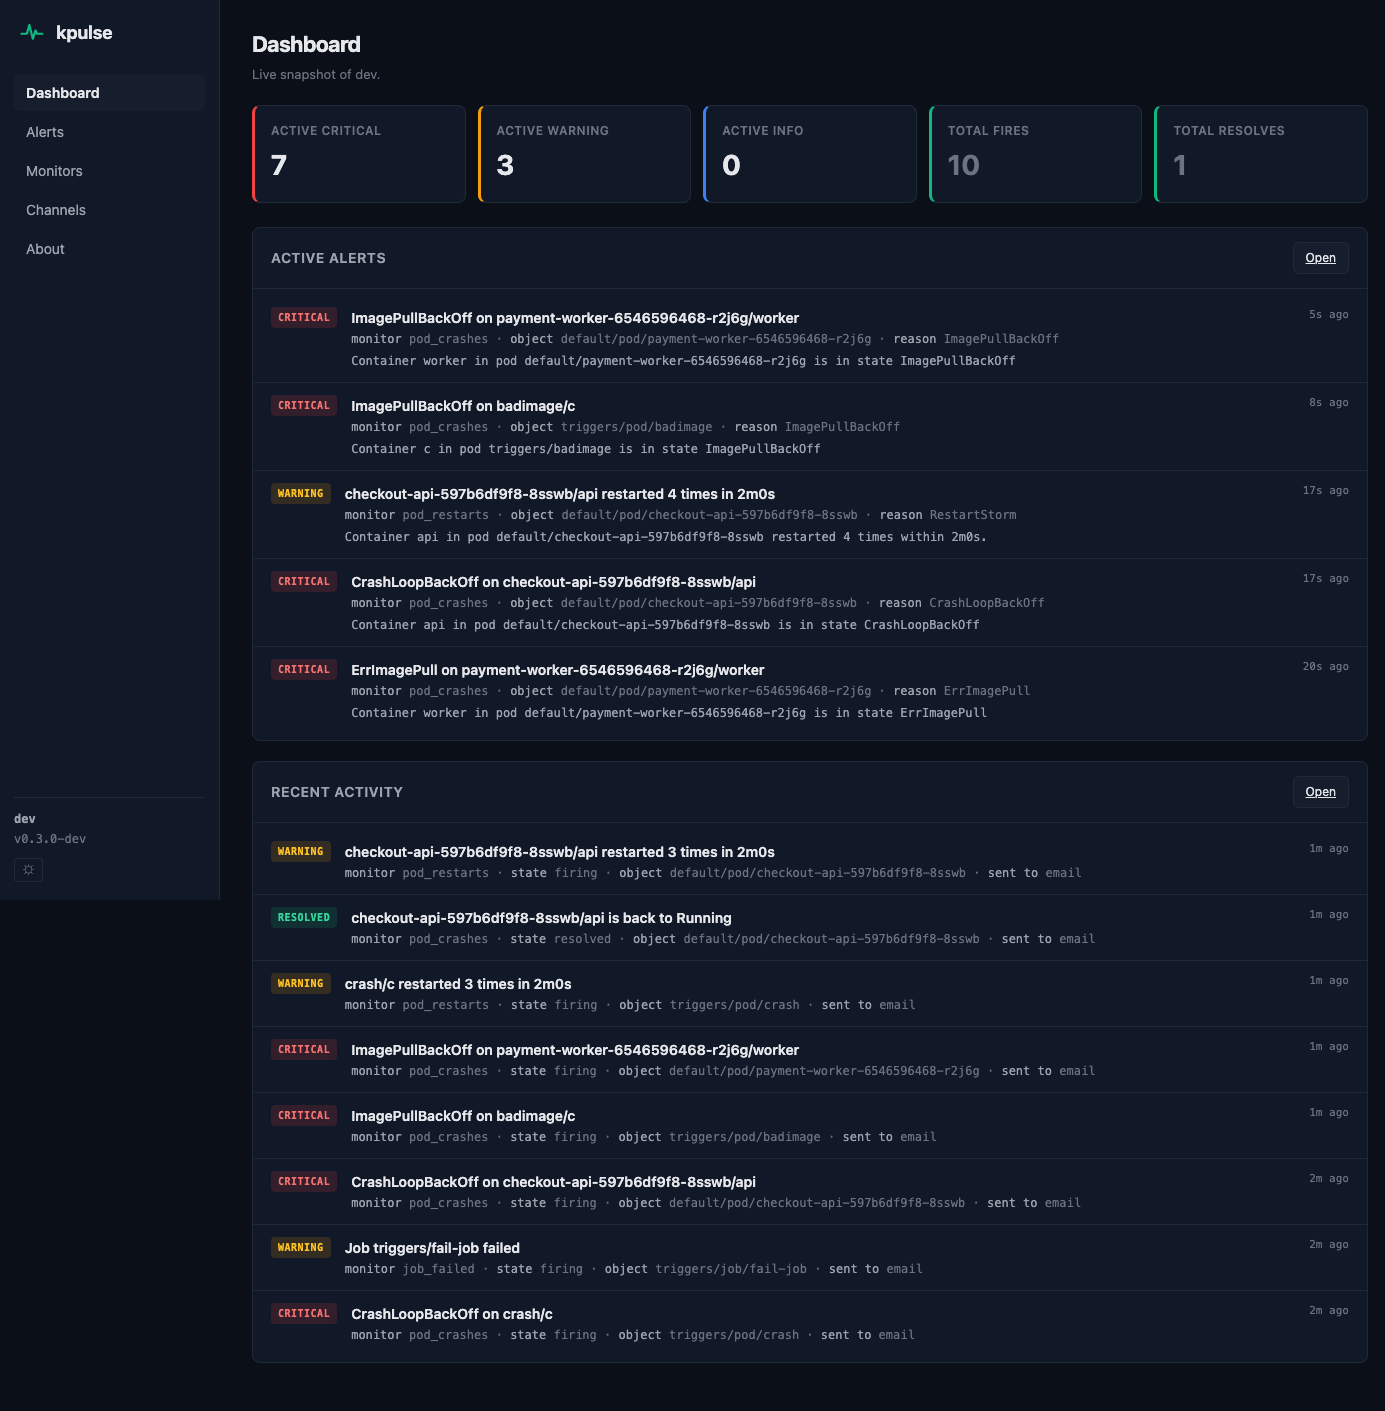
// dashboard: severity counters + active + recent in one view
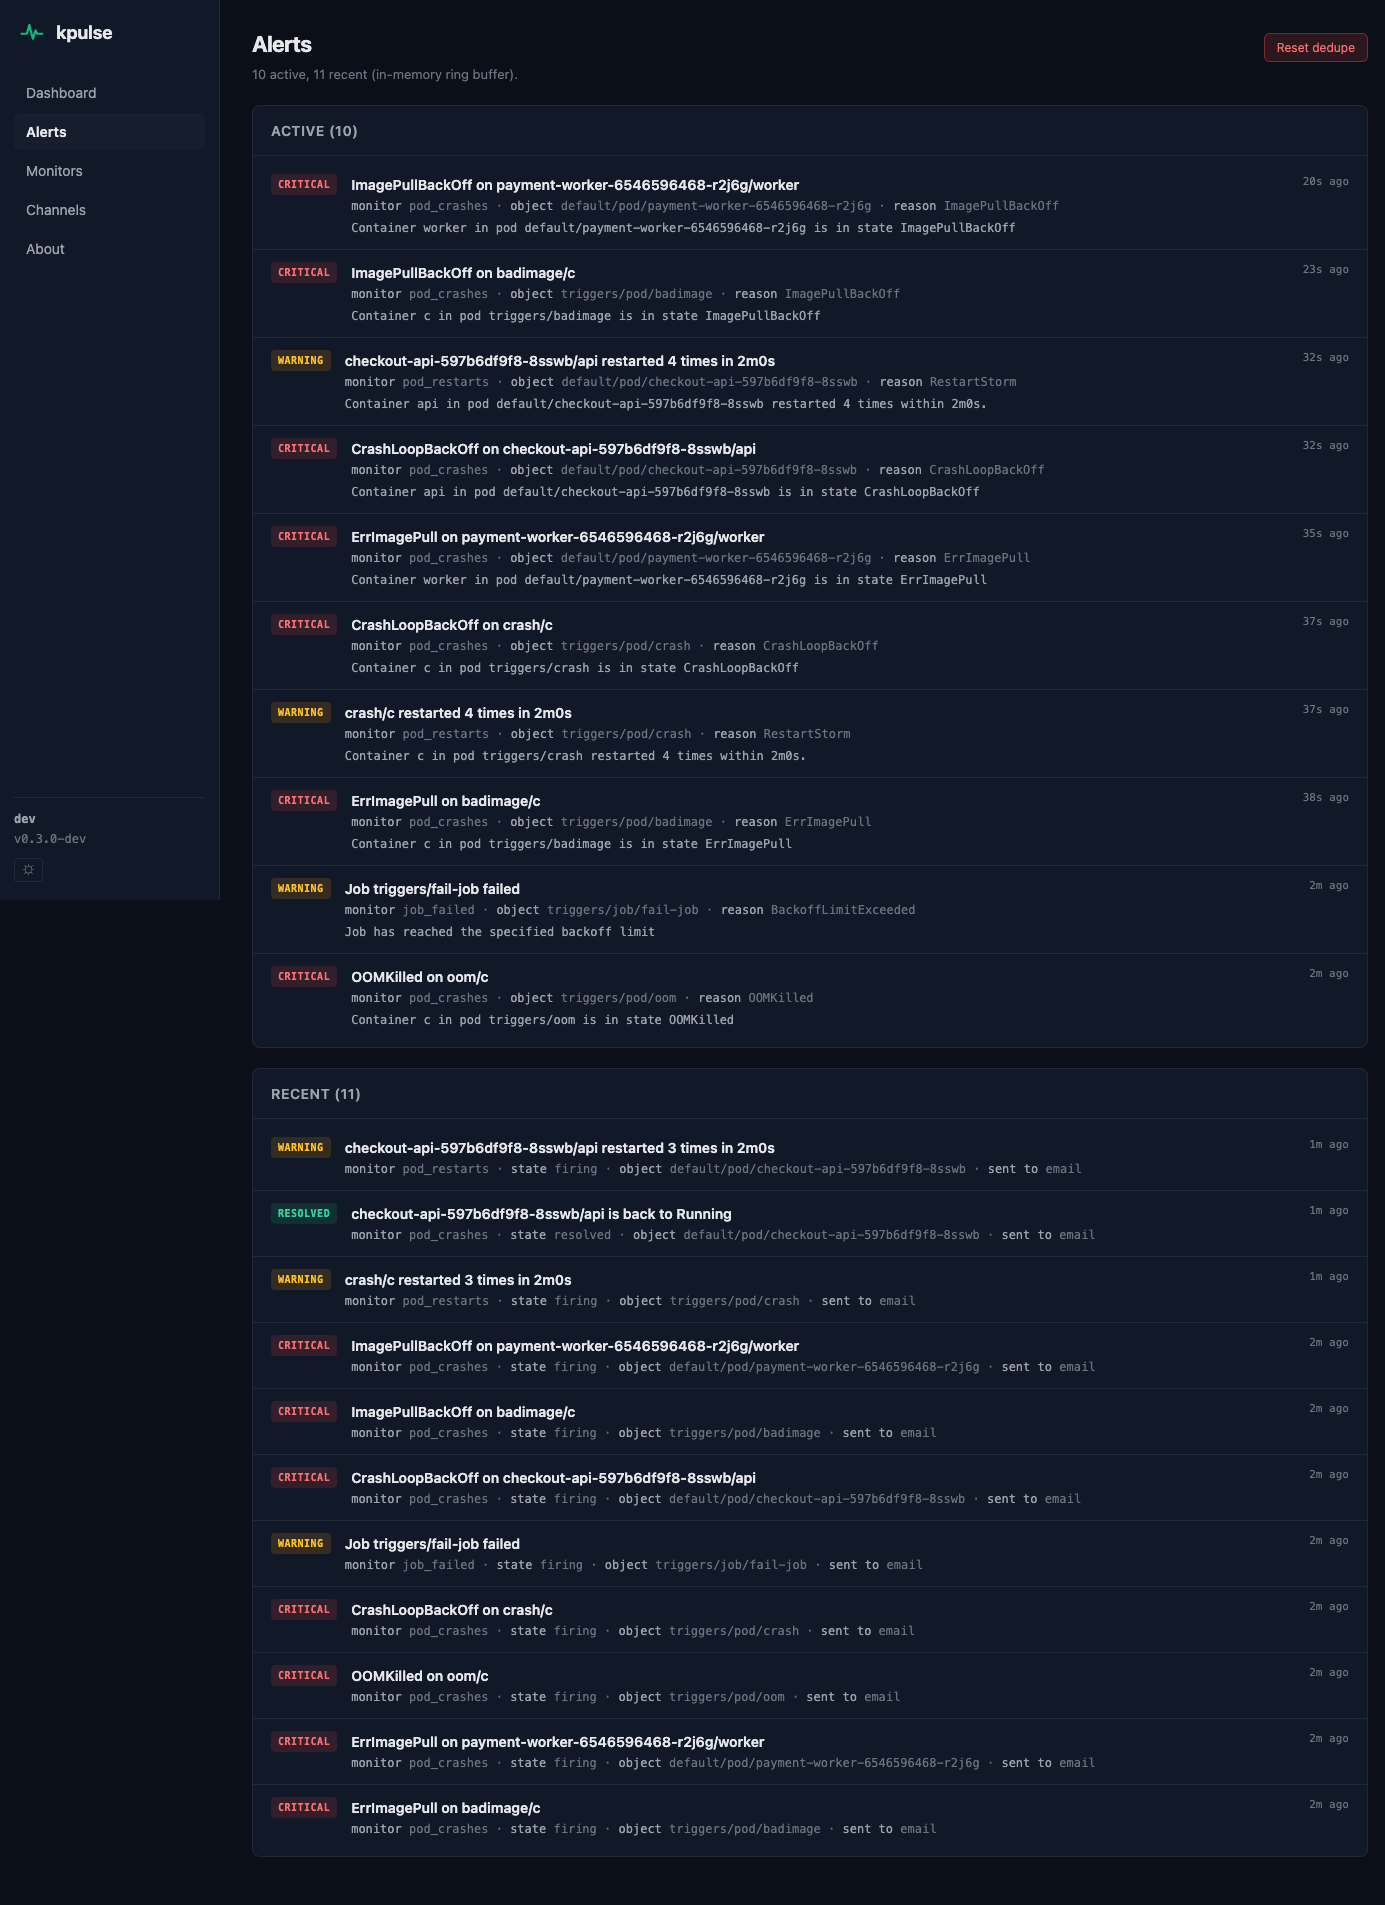
// alerts: full active set + recent ring buffer
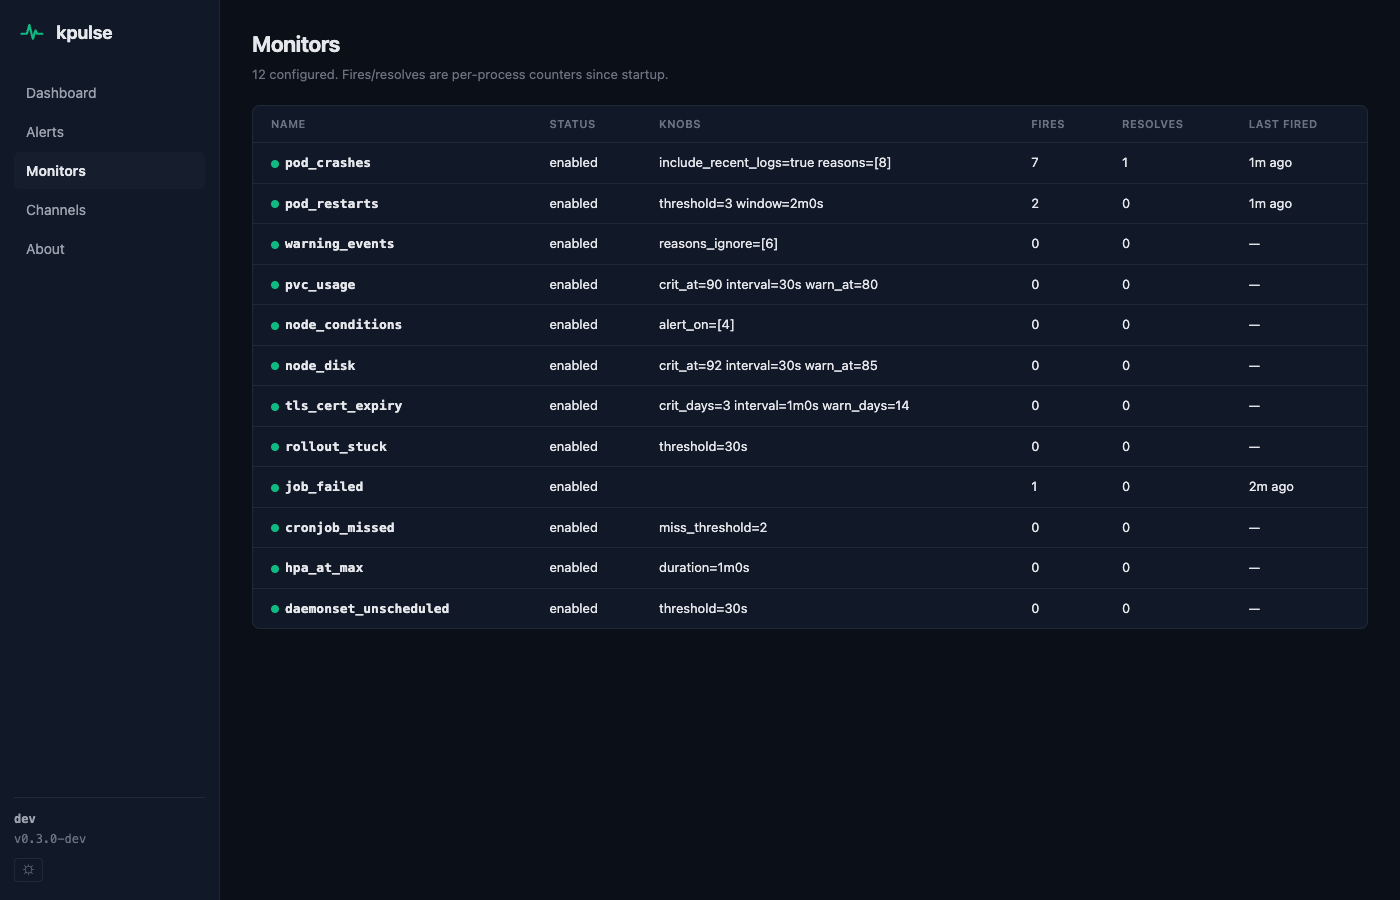
// monitors: all 12 with live fire/resolve counters
kpulse IS
- Day-1 alerts on common failures
- Lightweight: 1 Pod, ~64Mi RAM
- Slack / SMTP / Webhook / Discord / Teams
- Sensible thresholds out of the box
- Dedupe + digest engine
kpulse is NOT
- Not a metrics store
- No PromQL or time-series
- No silencing schedules or on-call rotation
- Not for teams already running a full observability stack
- No multi-cluster aggregation (one Pod per cluster)
// faq
Questions.
Does kpulse replace Prometheus?
No — it's an alternative. Prometheus is great until you realize you just wanted to know when a pod is crashing. If you need metrics, PromQL, and on-call schedules, run Prometheus. If you just want instant failure alerts, kpulse is the faster, lighter route.
How much does it cost to run?
One Pod, ~64Mi memory, ~10m CPU. On most clusters, the overhead is invisible.
What permissions does it need?
Read access to Pods, Events, PVCs, Nodes, Deployments, StatefulSets, Jobs, CronJobs, HPAs, DaemonSets, and Secrets (for TLS expiry checks).
Can I silence specific alerts?
Not via silencing rules. You can disable monitors entirely or tune thresholds in the ConfigMap. For full silencing, route to Alertmanager.
Is it open source?
Yes. MIT licensed. ~1500 LOC of Go in 7 packages. Issues and PRs welcome.
Stop discovering crashes
from your users.
One command. One Slack webhook. Twelve fewer pages at 3am.
curl -fsSL https://kpulse.io/install.sh | bash